 BusinessTech Academy
Santa Fe High School
BusinessTech Academy
Santa Fe High School
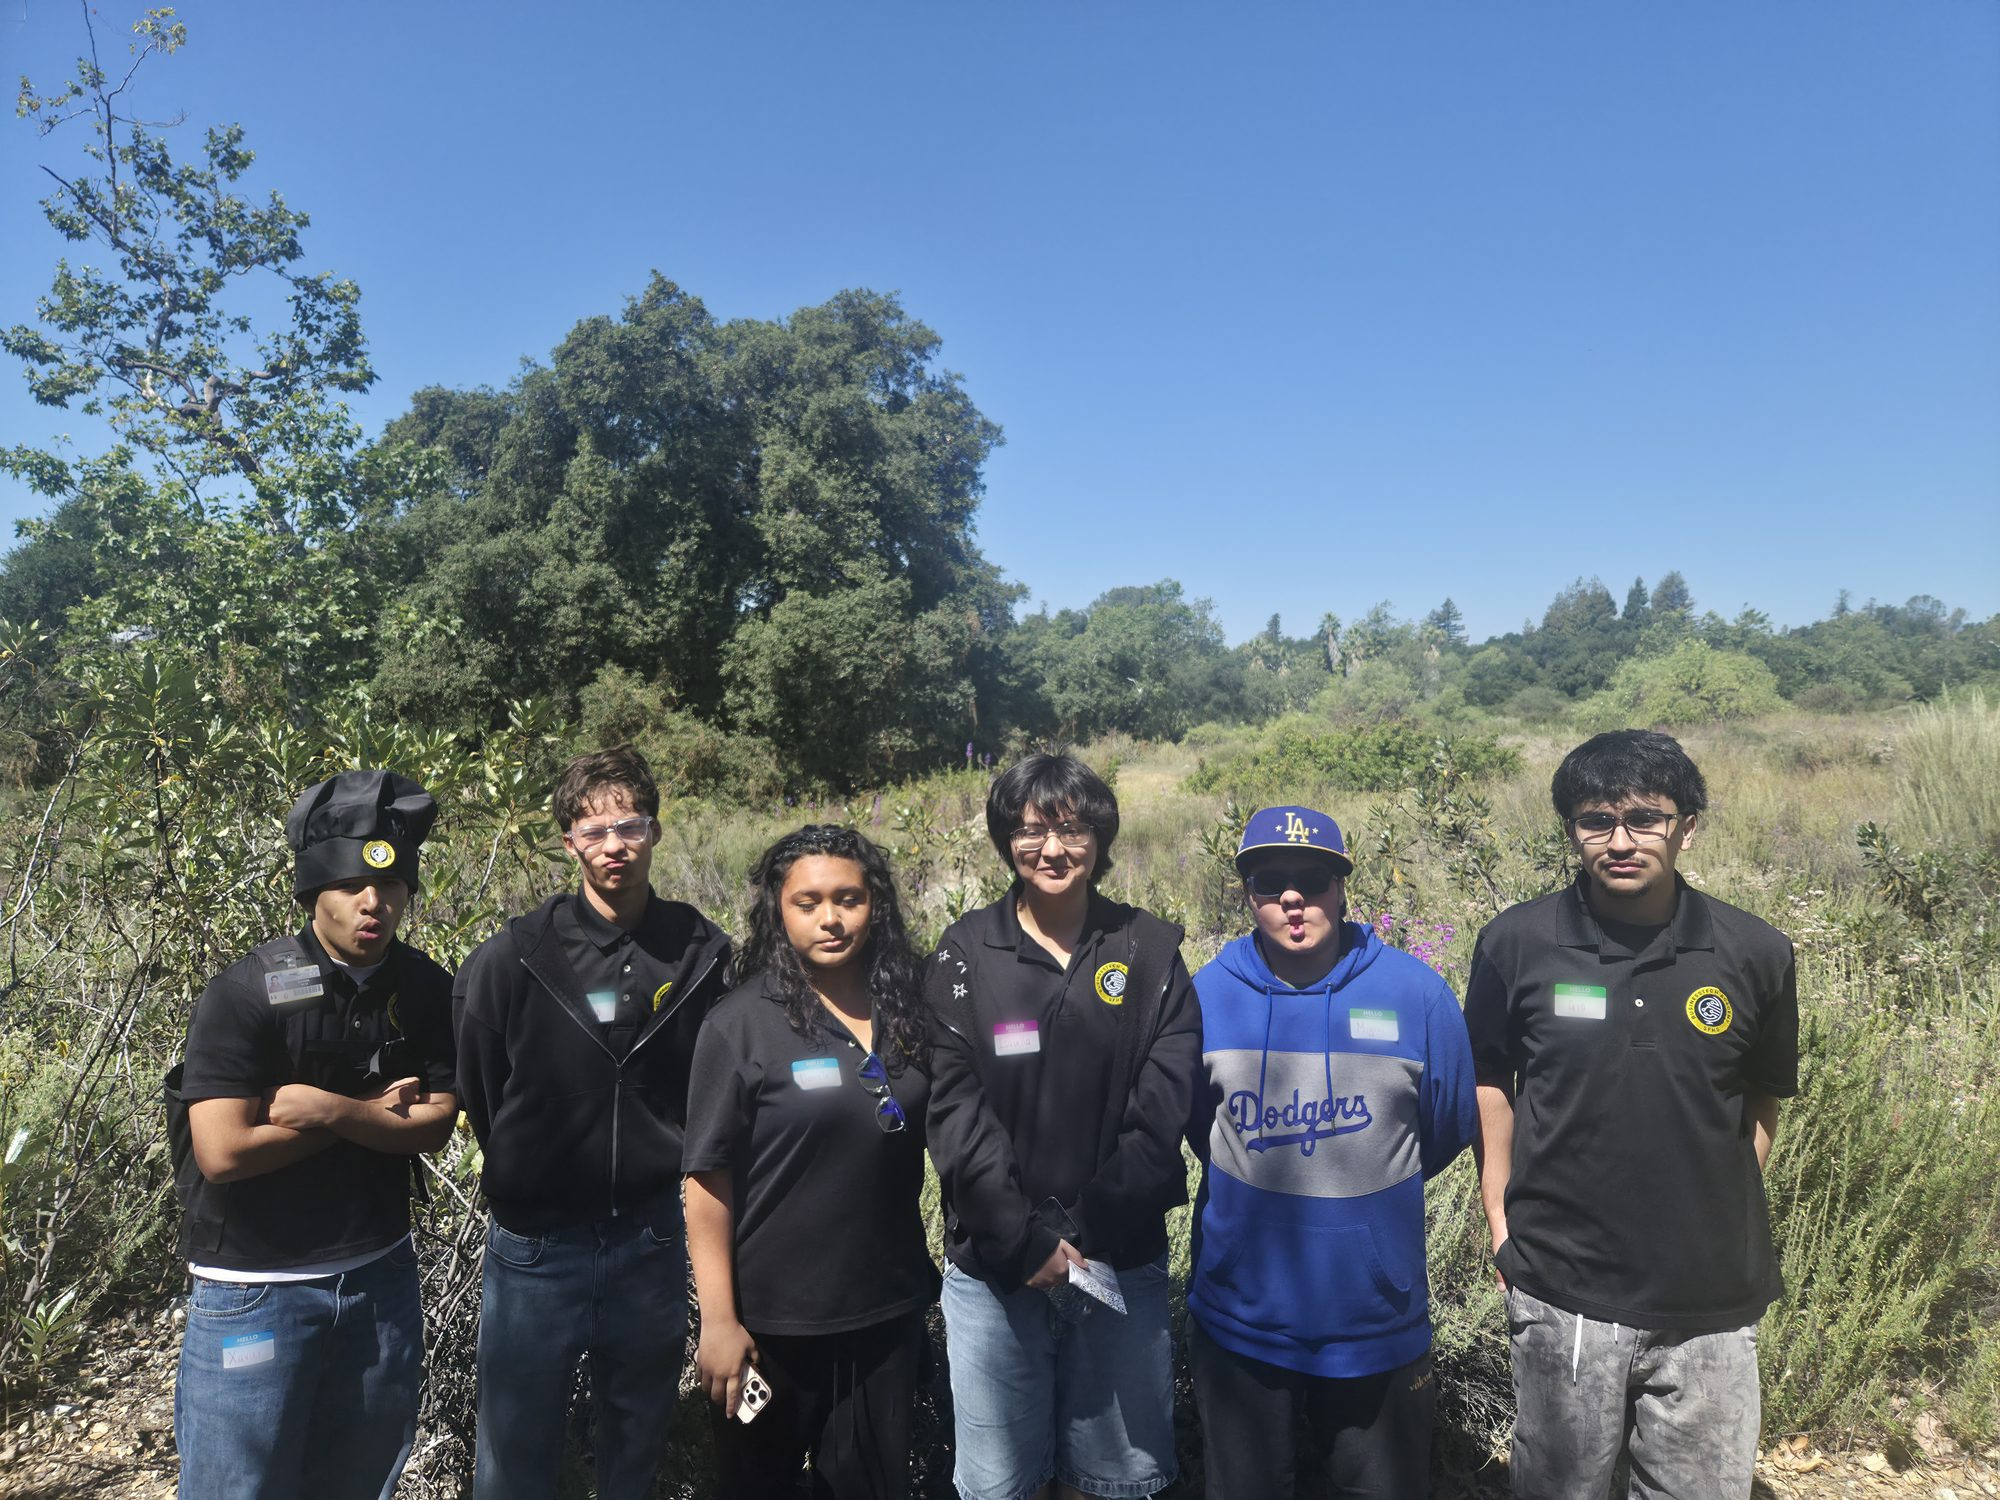
Bernard Field Station, Claremont
 Spatial analysis (GIS)
Investigations
Students work as GIS analysts, layering census and public health data over real cities and testing what they find against the street.
The woodrat survey
GIS field work with Rio Hondo College at the Robert J. Bernard Biological Field Station in Claremont, alongside the Robert Redford Conservancy at Pitzer College. Students logged woodrat nests with Survey123, on the ground they had been mapping on a screen.
It is not a classroom exercise with a real backdrop. The records join a decade of research by Pomona’s Karnovsky Lab tracking two woodrat species across 94 acres of coastal sage scrub — one of them a California Species of Special Concern.
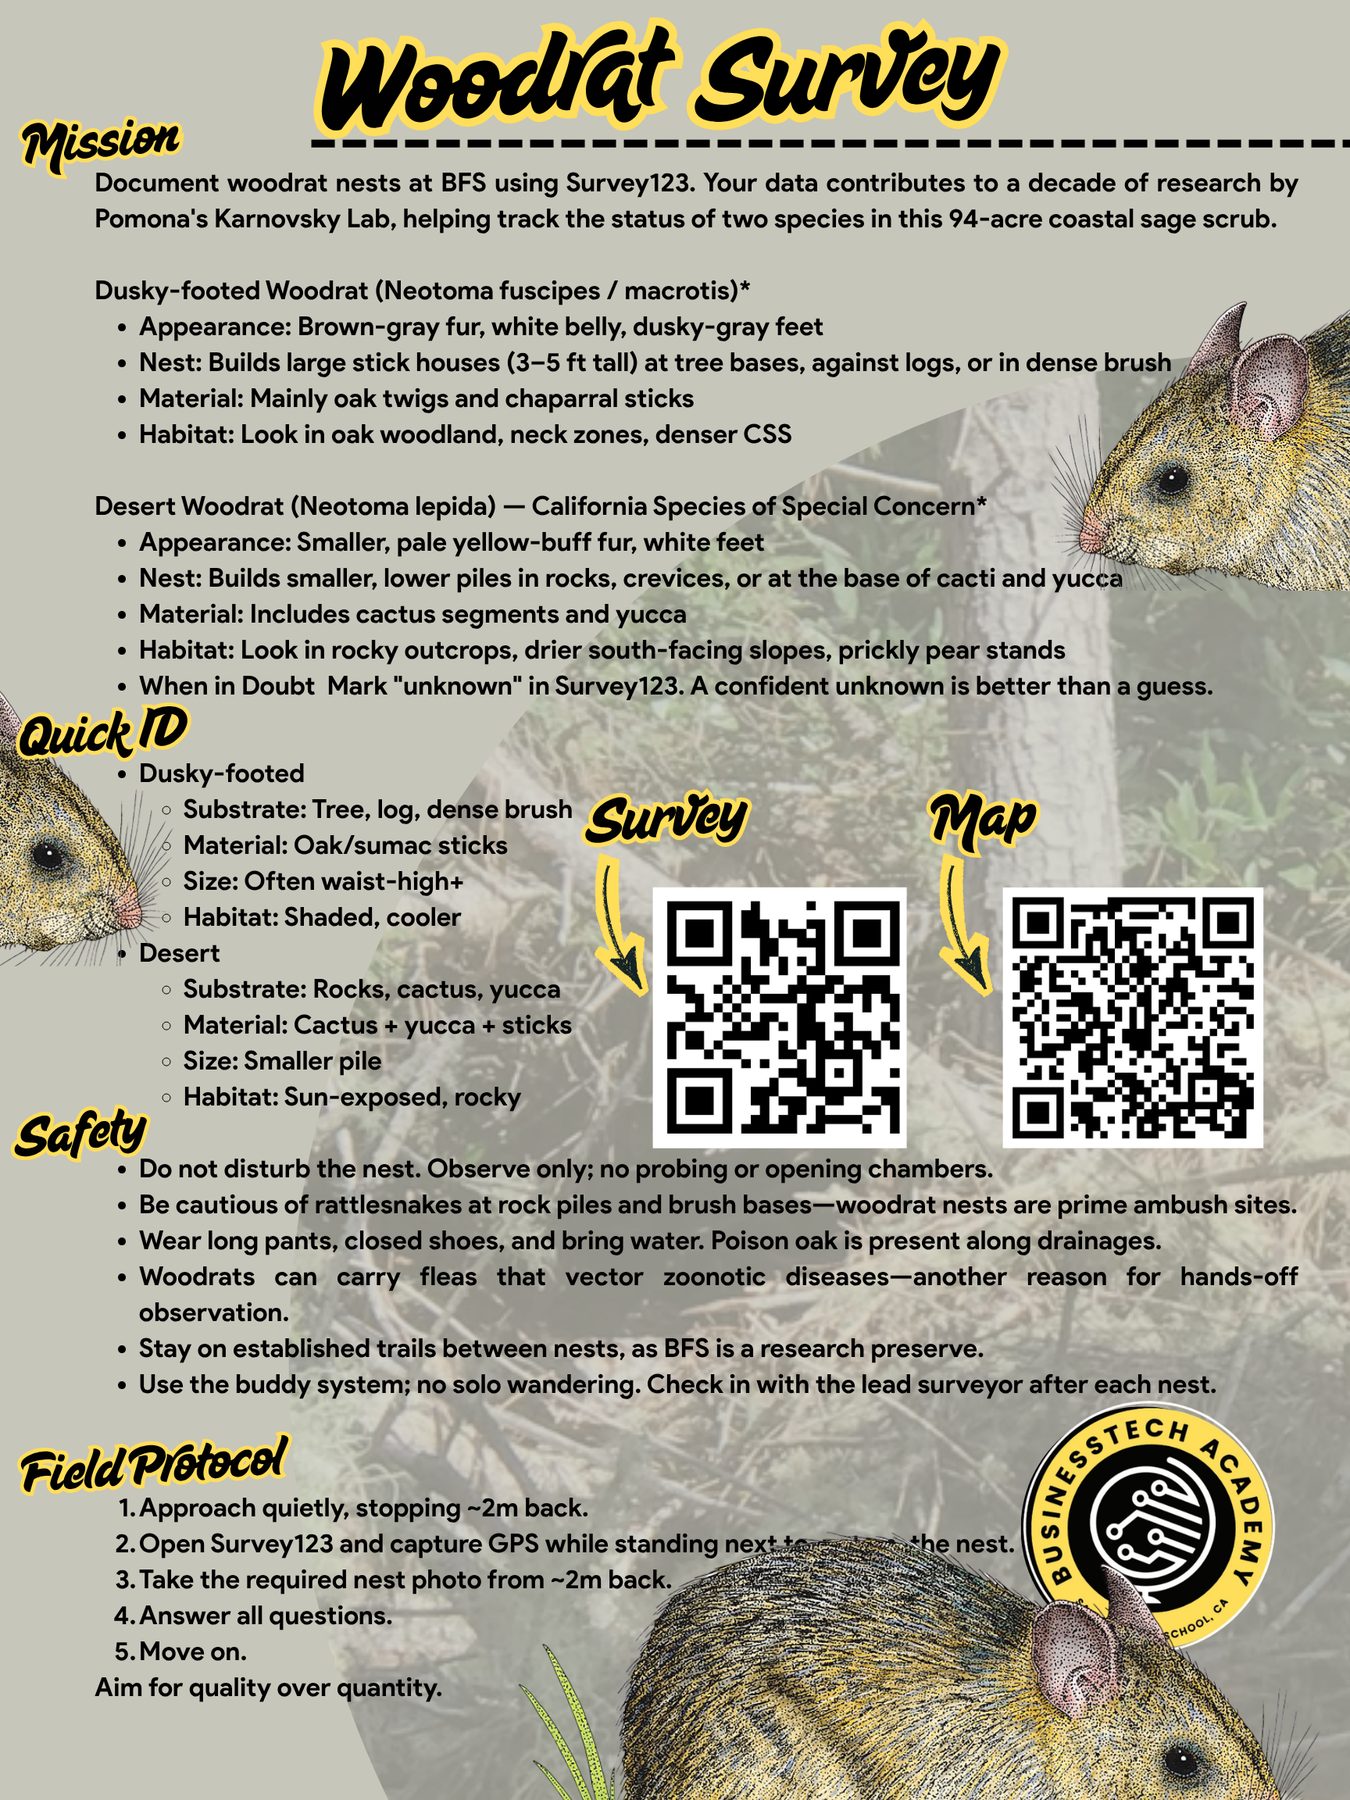
The one-pager is the whole job on a single sheet: the mission, how to tell the two species apart, what not to touch, and the five steps to follow at each nest. It was made to be carried outdoors and used, which is why it ends with “aim for quality over quantity” and tells you to mark an honest unknown rather than guess.
Understanding Los Angeles County
Students analyze Los Angeles County’s urban landscape by investigating spatial relationships between environmental resources and community demographics, examining how park access, forest cover, and pollution levels vary across neighborhoods with different income and education patterns. Working as GIS analysts, they layer census data with environmental features and use Google Street View to ground-truth their findings, building evidence-based arguments about how geography and urban planning shape environmental justice and quality of life across one of America’s most diverse counties.
InvestigateSan Francisco health crisis
In this spatial investigation, students analyze real San Francisco public health data to uncover correlations between sanitation incidents and underlying socioeconomic factors like income, education, homelessness, and park access. Working as GIS analysts, they combine map observations, demographic data layers, and Google Street View evidence to build nuanced, data-driven arguments about how urban inequality manifests in public health crises.
InvestigateNew York City health crisis
In this spatial investigation, students analyze NYC’s 311 rat sighting data to identify correlations between rodent complaints and urban factors like housing density, income levels, restaurant concentrations, and building conditions. Working as GIS analysts, they combine map observations, demographic data layers, and Google Street View evidence to construct data-driven explanations about how infrastructure, sanitation resources, and socioeconomic patterns shape public health challenges in America’s densest city.
Investigate